Introduction
This report examines the Total Breaking and Entering Incidents in 2014-2023 in Ontario, Alberta, and Manitoba through incident-based crime statistics. Breaking and entering is a crime in progress that directly challenges both personal and commercial security and is mostly accompanied by stealing, damaging property, as well as leaving the communities with an elevated feeling of fear. It is one of the indicators of crime trends in a local area which can be frequently related to more social factors of unemployment, drug-taking, or financial pressure. It is also a predictable and trackable crime and often occurs in time and place-based patterns, which makes it a great crime to perform trend analysis and hotspot identification.
Choice of Visualization Tool
As a dashboard tool, Power BI was selected due to its effectiveness in loading huge amounts of data, sophisticated data manipulations like filtering, pivoting and cleansing using the embedded Power Query Editor, and the creation of interactive dashboards. Power BI has native Python support, unlike Tableau, which needs additional tools to prepare the data and further setup to integrate with Python and is natively compatible with Excel and SQL Server. Its affordability, accessibility, and powerfulness of integration with the standard tools used in the public sector make it an optimal solution to use in the analysis and visualization of complex crime data in this project.
Data Analysis/ Visualization Approach
The original data is provided by Statistics Canada and has more than 10 GB of records with the following significant dimensions
- Geography (Geo): Province, city and rural/urban categories
- Violations: Crime Type and subclasses
- Statistics: Number of actual incidents and crime rate per 100,000 of the population, the rate of charging adults and youth, the total number of persons charged and other indicators.
To handle such amount, the dataset was reduced through a Python script, keeping only the records from the year 2010, eliminating zeroes and irrelevant statistics. Total Breaking and Entering Incidents were in the spotlight of the analysis, and appropriate statistical indicators were chosen.
In Power BI, With the help of power query editor, the dataset was cleaned and refined further and only the records of Total breaking & entering incidents in the past 10 years 2014 to 2023 were considered, the Statistics column was pivoted to aid comparison, and the nulls were changed to zero. Tables of Ontario, Alberta and Manitoba were prepared separately and then merged into one final table.
To facilitate geographic-level filtering, some calculated columns such as IsCity, IsProvince, IsRural, IsOther, and GeoType were used to categorize each record. This enabled specific filtering and comparison of crime trends per province, cities and other areas. A new table was created using DAX-powered SUMMARIZECOLUMNS to pull the top 5 cities with the highest incidents of crime per province. In-depth comparisons and correlation analyses were made focused on these cities. Visualizations were made to show annual trends, interprovincial and city level comparison.
Report Findings
A wide range of Power BI charts and indicators was created to analyze the Total Breaking and Entering Incidents in Ontario, Alberta, and Manitoba in 2014-2023.
Province level Crime Severity Comparison
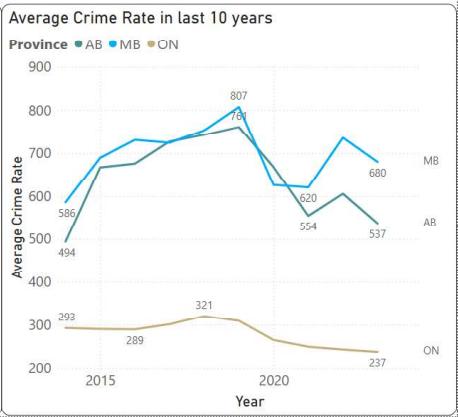
A Line chart is plotted by taking Year on x-axis and total breaking & entering crime incidents/Crime Rate per 1,00,000 population on y-axis for all three provinces in the last 10 years to compare the severity of total breaking & entering incidents at the province level.
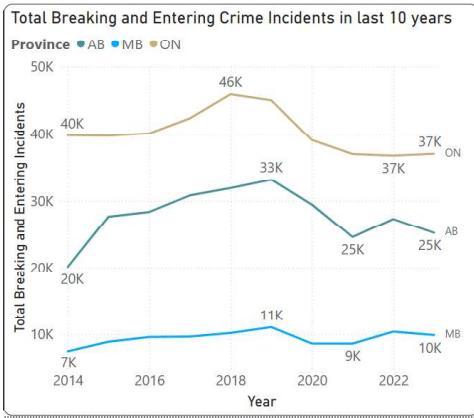
Analysis of Total Breaking and Entering Incidents in Ontario, Alberta, and Manitoba within the last 10 years shows significant regional trends.
The province of Ontario has stood out as the leader with the greatest number of incidents overall, slightly more than 46,000 in 2018 and hovering to a value of 37,000 in 2023. Alberta exhibited the peak of about 33,000 and then dropped to 25,000. Manitoba recorded the least number of total incidences of between 7,000 to 11,000.
The situation however is quite different when viewed according to the average crime rate. With the lowest number of crime instances, Manitoba had the highest average crime rate reaching 807 per 100,000 population. This implies that there is an excessive danger of breaking and entering, compared to the population. Conversely, Ontario saw a consistent drop in the rate of crime to 237 meaning better regulation compared to the population size. The rate of Alberta was changing with the final grade being 537, which means moderate improvement.
Conclusion
This section would contain the conclusion of the analysis.
Recommendations
This section would contain the recommendations based on the analysis.